The State of the Art in Visualizing Dynamic Graphs
- 论文原文:The State of the Art in Visualizing Dynamic Graphs
- 作者:Fabian Beck, Michael Burch, Stephan Diehl, and Daniel Weiskopf
- 发表刊物/会议: Eurographics Conference on Visualization (EuroVis2014)
论文前半部分讲其如何收集数据,如何进行分类等等,就不再细述,直接从介绍方法开始。
有个表格比较有意思,这里展示一下:
| 类型 | 论文类型 |
|---|---|
| application(应用) | 讲动态图可视化方法应用于某个特定领域 |
| evaluation(评估) | 系统,理论地对可视化方法进行评估 |
| technique(技术) | 新颖的可视化技术或系统 |
| 时间表达方法 | |
|---|---|
| animation(动画) | 利用动画来映射不同的时间 |
| timeline(时间轴) | 将时间映射到时间轴上的空间 |
| generic(一般) | being applicable to all representations of time |
| 图的表达方法 | |
|---|---|
| node-link(节点链接) | 用链接连起来的节点 |
| matrix(矩阵) | 邻接矩阵 |
| generic(一般) | being applicable to all graph representations |
| 评估 | 评估的类型 |
|---|---|
| algorithmic | 用指标来算法性的评估表达方法 |
| case_study | 用一些应用案例来进行讨论 |
| none | 没有 |
| user_study | 通过其他用户来进行用户实验 |
| expert | 通过其他领域或者可视化专家来评价方法 |
| survey | 相关工作的调研 |
| theoretical | 证明或者是运行时间复杂度的理论考察 |
| 应用 | |
|---|---|
| biology | bioinformatics data such as protein interactions or metabolic pathways |
| business | business- or economy-related data such as financial transactions, stock market, business processes |
| document | document collections, bibliometrics, and information re- trieved from texts |
| eye_tracking | data recorded during eye-tracking experiments |
| infrastructure | infrastructure networks such as computer, communica- tion, power, or road networks |
| media | data related to movies, TV, music, news and the like |
| social | social networks, social media, and other data from social life |
| software_engineering | information related software such as components, source code, developers, documentation, etc. |
| sports | sports-related data such as performance data or results |
| generic | no specific application suggested |
Animation(动画)
一般布局(General-Purpose Layout)
一般可以分为online和offline两种大类,online的表示只考虑过去的time step,来计算当前的布局;而offline则考虑了过去跟未来的,能够维持更好的mental map。
Online Problem
一开始这个问题始于 交互,因为在进行交互的时候,过去的时间片段已知,而未来的时间片段仍然是未知的。
- 【MISUE K., EADES P., LAI W., SUGIYAMA K.: Layout adjustment and the mental map. Journal of Visual Languages & Computing 6, 2 (1995), 183–210. 】:解决图编辑以及节点重叠的问题:让力引导算法要保持节点之间初始的垂直和水平位置的顺序。
- 【BRANDES U., WAGNER D.: A Bayesian paradigm for dynamic graph layout. In Graph Drawing (1997), GD, Springer, pp. 236–247.】:用贝叶斯决策理论(Bayesian decision theory)来描述问题:在出初始布局上考虑可读性(readability model)以及考虑后面的布局与初始布局之间的差距,即稳定性(stability model)
- 【LEE Y.-Y., LIN C.-C., YEN H.-C.: Mental map preserving graph drawing using simulated annealing. In Proceedings of the 2006 Asia-Pacific Symposium on Information Visualisation (2006), APVis, Australian Computer Society, Inc., pp. 179–188】:将这个问题考虑成一个优化问题,模拟退火算法,针对有权图。
- 【GOROCHOWSKI T. E., DI BERNARDO M., GRIERSON C. S.: Using aging to visually uncover evolutionary processes on networks. IEEE Transactions on Visualization and Computer Graphics 18, 8 (2012), 1343–1352.】:引入节点年龄(node age)的概念来保持布局
- 【FRISHMAN Y., TAL A.: Online dynamic graph drawing. IEEE Transactions on Visualization and Computer Graphics 14, 4 (2008), 727–740】利用了GPU进行了加速布局计算
- HAYASHI A., MATSUBAYASHI T., HOSHIDE T., UCHIYAMA T.: Initial positioning method for online and real-time dynamic graph drawing of time varying data. In Proceedings of the 17th International Conference on Information Visualisation (2013), IV, pp. 435–444.】:调研了初始节点位置对布局算法的影响
Offline Problem
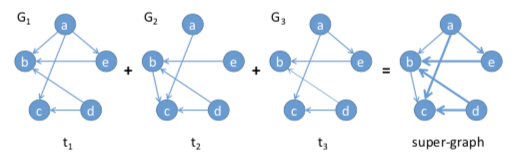
首先需要明白一个super-graph的概念,存在时间越长的边,会在super-graph中拥有更高的权重。
- 【DIEHL S., GÖRG C., KERREN A.: Preserving the mental map using foresighted layout. In Proceedings of the 3rd Joint Eurographics–IEEE TCVG Conference on Visualiza- tion (2001), VisSym, Eurographics Association, pp. 175–184.】:提出了foresighted layout算法,将不活跃的节点聚集在一起,然后再构建super-graph。
- 【DIEHL S., GÖRG C.: Graphs, they are changing – dynamic graph drawing for a sequence of graphs. In Graph Draw- ing, GD. Springer-Verlag, 2002, pp. 23–31.】:引入了Tolerance的概念,允许一定程度的偏移,可以为每一帧的布局继续用力引导做优化
- 【ERTEN C., HARDING P. J., KOBOUROV S. G., WAMPLER K., YEE G.: GraphAEL: Graph animations with evolving layouts graph drawing. In Graph Drawing, GD. Springer, 2004, pp. 98–110.】:相同的节点用虚拟边相连,并忽略来自不同帧的相同节点之间的斥力。
- 【BAUR M., SCHANK T.: Dynamic Graph Drawing in Visone. Tech. rep., Fakultät für Informatik, Universität Karlsruhe, 2008.】:引入了能量因子(energy factors)的概念,相同的节点之间的位置距离越远,能量越高,目标是最小化能量。
- 【FENG K.-C., WANG C., SHEN H.-W., LEE T.-Y.: Coherent time-varying graph drawing with multifocus+context interaction. IEEE Transactions on Visualization and Computer Graphics 18, 8 (2012), 1330–1342.】:可以选择多个焦点,聚焦的焦点以及他们的邻域都会被放大。
Transition Problem
因为动画过程中,经常会在同一时间内发生太多的变化,用户难以追踪。
【HUANG M. L., EADES P., WANG J.: On-line animated visualization of huge graphs using a modified spring algorithm. Journal of Visual Languages & Computing 9, 6 (1998), 623–645.】:当聚焦到一个节点上的时候,这个节点会被转到中间,然后节点再消失和出现。
【FRIEDRICH C., EADES P.: The Marey graph animation tool demo. In Graph Drawing (2001), GD, Springer, pp. 396–406.】:将整个过程分成四个阶段:1. 需要消失节点和边消失掉;2. 布局进行转换;3. 单独的那些节点被转换到新的位置上;4. 新增节点和边
【FRIEDRICH C., HOULE M. E.: Graph drawing in motion II. In Graph Drawing (2002), GD, Springer, pp. 220–231.】:对上述的工作进行了扩展,节点进行了聚类,然后再一起运动
【NESBITT K. V., FRIEDRICH C.: Applying gestalt princi- ples to animated visualizations of network data. In Proceedings of the 6th International Conference on Information Visualisation (2002), IV, IEEE, pp. 737–743.】:推荐用Gestalt laws来捕获/组织运动过程
【LOUBIER E., DOUSSET B.: Temporal and relational data representation by graph morphing. Safety and Reliability for Managing Risk 14, 02 (2008), 2008–16.】:(对不起没读懂,大概讲的是在变化为上一帧布局变换到下一帧的时候,先对齐到super-graph,以维护mental map)a super-graph layout is computed with nodes in the same time step attracted to a specific position; for the transition between two time steps, the graph is first morphed to the super-graph to recalibrate the mental map, before the super-graph is further transformed into the layout of the next time-step.
【HURTER C., ERSOY O., FABRIKANT S., KLEIN T., TELEA A.: Bundled visualization of dynamic graph and trail data. IEEE Transactions on Visualization and Computer Graph- ics (2013).】:假如节点位置固定,则可以利用edge bundling的方法来展示边的变化。
【BACH B., PIETRIGA E., FEKETE J.-D.: GraphDiaries: Animated transitions and temporal navigation for dynamic networks. IEEE Transactions on Visualization and Computer Graphics 20, 5 (2014), 740–754.】:类似上面的,但是会高亮那些移除的活着新增的元素。
特殊目的布局(special-purpose layout)
Compound Graph(复合图)
动态复合图的布局,需要在不同时刻追踪聚类,不仅要保持布局稳定,也要保持聚类的稳定。
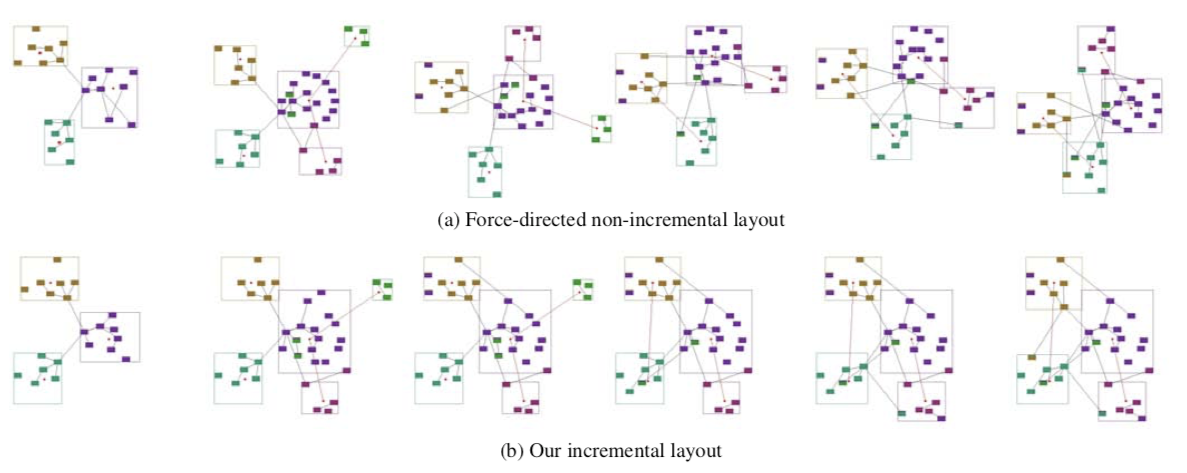
【FRISHMAN Y., TAL A.: Dynamic drawing of clustered graphs. In Proceedings of the 2004 IEEE Symposium on Infor- mation Visualization (2004), InfoVis, IEEE, pp. 191–198.】:一种online的方法,在聚类外面绘制盒子,保证节点在该范围内。(下图上面是不加该方法的布局,下图是加入了文章的方法)
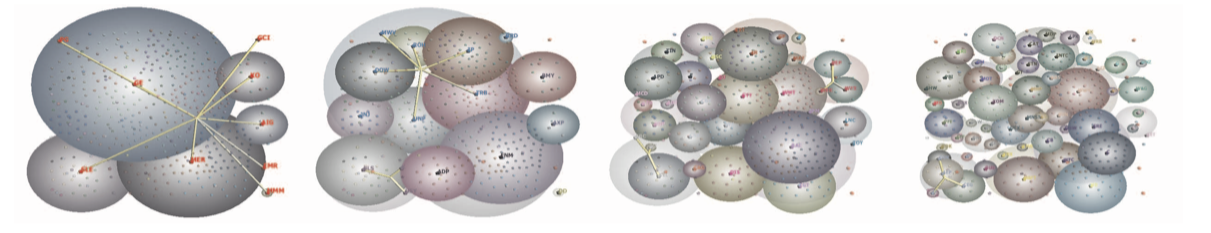
【[KG06] KUMAR G., GARLAND M.: Visual exploration of com- plex time-varying graphs. IEEE Transactions on Visualization and Computer Graphics 12, 5 (2006), 805–812.】:针对3D图,画上气泡来表达复合的结构。
【POHL M., BIRKE P.: Interactive exploration of large dynamic networks. In Proceedings of the 10th Inter- national Conference on Visual Information Systems (2008), VISUAL, Springer-Verlag, pp. 56–67.】:是对foresighted layout的一种扩展,做了一个个嵌套的盒子。
【REITZ F., POHL M., DIEHL S.: Focused animation of dynamic compound digraphs. In Proceedings of the 13th Interna- tional Conference on Information Visualisation (2009), IV, IEEE Computer Society, pp. 679–684】:利用层次结构,折叠不变的结构,使得动画更加清楚。
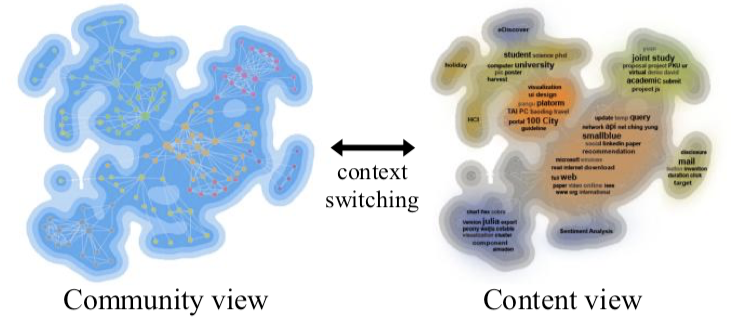
【LIN Y.-R., SUN J., CAO N., LIU S.: ContexTour: Contextual contour visual analysis on dynamic multi-relational clustering. In Proceedings of the 2010 SIAM International Con- ference on Data Mining (2010), SDM, pp. 418–429.】:用不同颜色的contour map来表示不同的聚类。
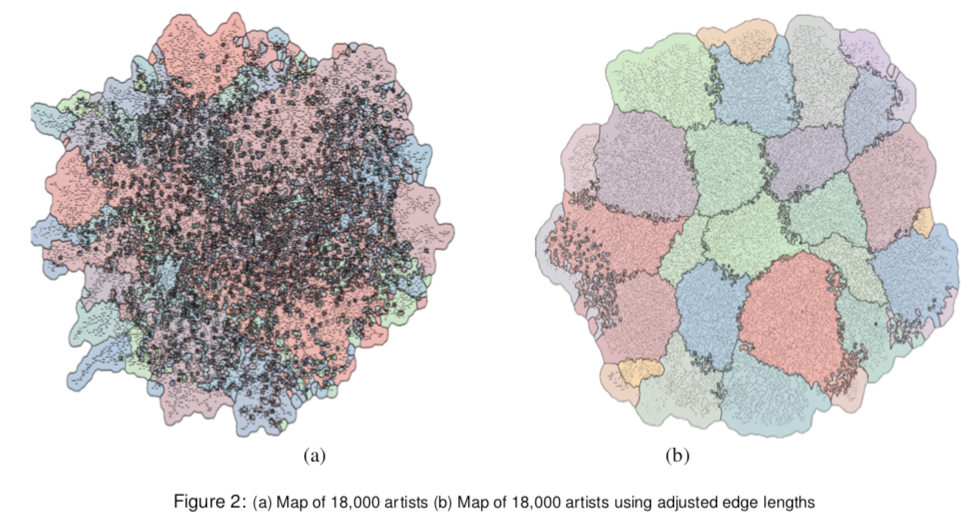
【MASHIMA D., KOBOUROV S., HU Y.: Visualizing dynamic data with maps. IEEE Transactions on Visualization and Computer Graphics 18, 9 (2012), 1424–1437.】【HU Y., KOBOUROV S. G., VEERAMONI S.: Embed- ding, clustering and coloring for dynamic maps. In Proceedings of the 2012 IEEE Pacific Visualization Symposium (2012), Paci- ficVis, IEEE Computer Society, pp. 33–40.】:是对上述算法的拓展,用空间填充的方法来绘制。
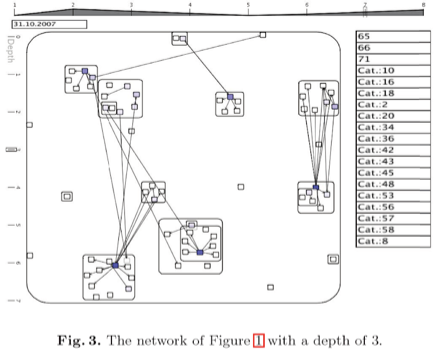
【ABELLO J., HADLAK S., SCHUMANN H., SCHULZ H.-J.: A modular degree-of-interest specification for the vi- sual analysis of large dynamic networks. IEEE Transactions on Visualization and Computer Graphics 20, 3 (2013), 337–350.】:当用户分析图的某一部分的细节时,利用DOI方法对其他部分进行聚类。
Other
针对planar graph和acyclic graph,不再细述。
Timeline(时间到空间的映射)
能提供整体的视角,但因为每个图的空间都缩小了,会降低可读性。在这种方法下,scalability时主要挑战。
基于节点链接的方法(Node-Link-Based)
Juxtaposed(并列)
存在的问题:
- 相邻两帧之间差距不大,不便观察
- 难以追踪某个特定节点
- 每幅图都太小,以至于会有杂乱
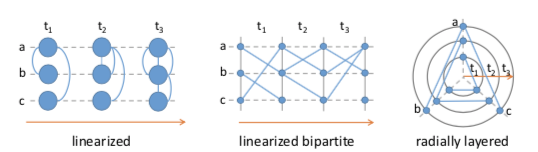
- 【GREILICH M., BURCH M., DIEHL S.: Visualizing the evolution of compound digraphs with TimeArcTrees. Computer Graphics Forum 28, 3 (2009), 975–982.】:将节点摆放在水平线上,以便追踪,但可读性比较差,如上图最左边。
- 【BURCH M., VEHLOW C., BECK F., DIEHL S., WEISKOPF D.: Parallel Edge Splatting for scalable dynamic graph visualization. IEEE Transactions on Visualization and Computer Graphics 17, 12 (2011), 2344–2353.】:提出了一种新方法:Parallel Edge Splatting,如 上图中间,它将垂直排列的图人为的分成二部图,这个二部图中边的方向都是从左向右的。
- 【BURCH M., BECK F., WEISKOPF D.: Radial Edge Splatting for visualizing dynamic directed graphs. In Proceed- ings of the 4th International Conference on Information Visu- alization Theory and Applications (2012), IVAPP, SciTePress, pp. 603–612】:是对Parallel Edge Splatting的一种圆形的拓展。
- 【BURCH M., FRITZ M., BECK F., DIEHL S.: Time- SpiderTrees: A novel visual metaphor for dynamic compound graphs. In Proceedings of the IEEE Symposium on Visual Lan- guages and Human-Centric Computing (2010), VL/HCC, IEEE, pp. 168–175.】:将node-link方法转换到嵌套的圆形中,如上图右边,但并不会画出所有的边,只会画一部分。
- 【FARRUGIA M., HURLEY N., QUIGLEY A.: Exploring temporal ego networks using small multiples and tree-ring layouts. In Proceedings of the 4th International Conference on Ad- vances in Computer-Human Interactions (2011), ACHI, pp. 79– 88.】使用了一种相似的布局方法来表达ego-centered的动态图
Superimposed(重叠的)
重叠的画法,需要节点在相同的位置,并且不同时间的边应该有不同的样式。将多个2D的图堆叠起来就会形成3D,但这些堆叠的图层是离散的,故而只能说成是2.5D。
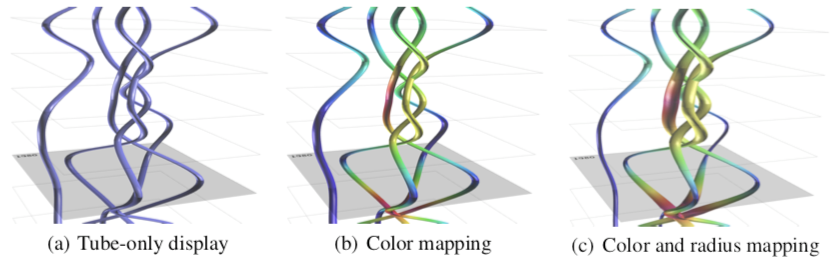
【DWYER T., EADES P.: Visualising a fund manager flow graph with columns and worms. In Proceedings of the 6th In- ternational Conference on Information Visualisation (2002), IV, IEEE, pp. 147–152.】:在不可见的2D平面上放置3D圆柱体。
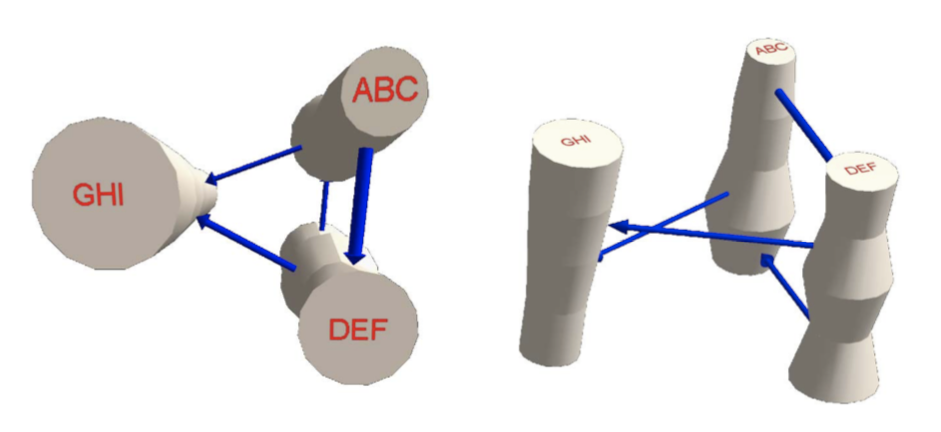
【BRANDES U., CORMAN S. R.: Visual unrolling of network evolution and the analysis of dynamic discourse. In- formation Visualization 2, 1 (2003), 40–50.】:跟上者类似,放置3D的圆柱体代表节点,用一些半透明的平面来表达图层,下图左。
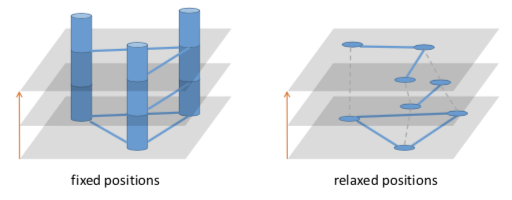
【ERTEN C., KOBOUROV S. G., LE V., NAVABI A.: Si- multaneous graph drawing: Layout algorithms and visualization schemes. In Graph Drawing (2004), GD, Springer, pp. 437–449.】:如上图右,允许节点有不同的位置,他们使用了一种改进的李引导算法,使得节点大致保持同一位置,以保留mental map。
【GROH G., HANSTEIN H., WÖRNDL W.: Interactively visualizing dynamic social networks with DySoN. In Proceedings of the 2009 Workshop on Visual Interfaces to the Social and the Semantic Web (2009), VISSW.】:拓展上述方法,将上图右边的虚拟的虚线,以管状进行绘制。
Integrated(集成)
在集成图里面,时间轴会被加入到节点链接图里面,那么,在不破坏布局的情况下,不同时间片段的图就不可能被单独抽离。
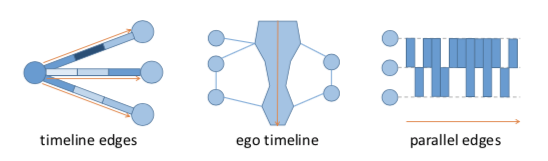
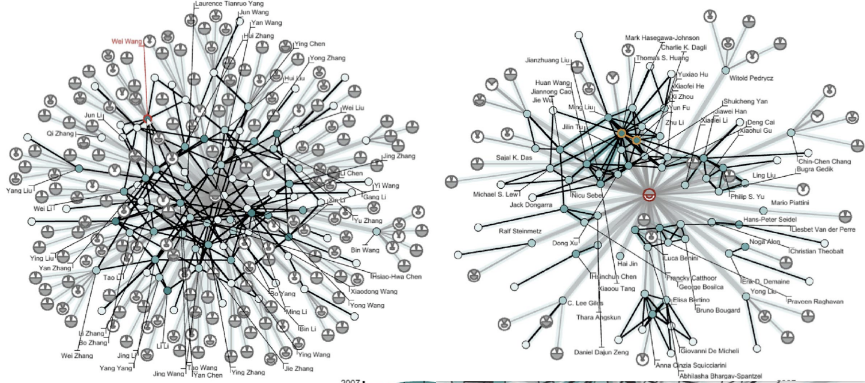
- 【REITZ F.: A framework for an ego-centered and time-aware visualization of relations in arbitrary data reposito- ries. arXiv preprint arXiv:1009.5183 (2010).】:在ego networks上,将时间轴编码到边上,边的权重演变被编码成分段的颜色,故而每条边都是一个独立的时间轴,上图左。
- 【SHI L., WANG C., WEN Z.: Dynamic network visualization in 1.5D. In Proceedings of the 2011 IEEE Pa- cific Visualization Symposium (2011), PacificVis, pp. 179–186.】:针对ego network,将中心节点变成时间轴,每当新的边出现的时候,将它们按照时间书序依次连接到中心的时间轴上,上图中。
- 【VAN DEN ELZEN S., HOLTEN D., BLAAS J., VAN WIJK J.: Dynamic network visualization with extended massive sequence views. IEEE Transactions on Visualization and Computer Graphics (2013).】:针对边代表瞬时事件的图(也即这些事件并不会持续一段时间),提出Extended Massive Sequence Views,事件被绘制在水平线上,节点则被排列在垂直线上,如上图右。
基于矩阵的方法(Matrix-Based)
单元内部的时间轴(Intra-Cell Timelines)
每一个单元格都会抱憾一条独立的时间轴。有很多不同的时间轴表达方法,如下图所示。
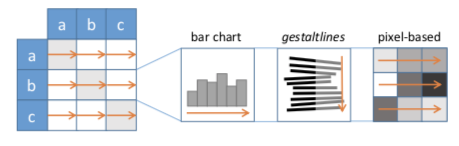
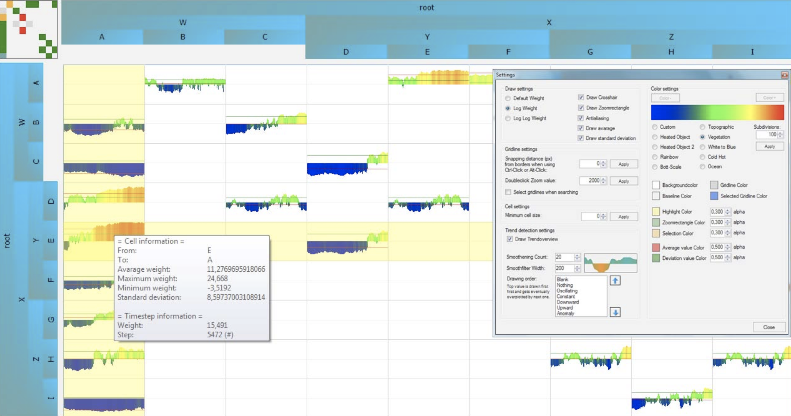
【BURCH M., SCHMIDT B., WEISKOPF D.: A matrix-based visualization for exploring dynamic compound digraphs. In Proceedings of the 17th International Conference Information Visualisation (2013), IV, IEEE, pp. 66–73.】&【YI J. S., ELMQVIST N., LEE S.: TimeMatrix: Analyzing temporal social networks using interactive matrix-based visualizations. International Journal of Human-Computer In- teraction 26, 11-12 (2010), 1031–1051.】:直接放置了一条水平的bar chart,如上图左。
【BURCH M., SCHMIDT B., WEISKOPF D.: A matrix-based visualization for exploring dynamic compound digraphs. In Proceedings of the 17th International Conference Information Visualisation (2013), IV, IEEE, pp. 66–73.】:在矩阵边上放置层次结构,从而来表达一个动态的复合图。
【YI J. S., ELMQVIST N., LEE S.: TimeMatrix: Analyzing temporal social networks using interactive matrix-based visualizations. International Journal of Human-Computer In- teraction 26, 11-12 (2010), 1031–1051.】:节点是聚合后的时间轴,不同的边类型就用不同的颜色进行编码。
【BRANDES U., NICK B.: Asymmetric relations in longitudinal social networks. IEEE Transactions on Visualization and Computer Graphics 17, 12 (2011), 2283–2290.】:利用叫做Gestaltlines的表达方法,使用了堆叠的线条,线条的角度,左面长度和右面长度可以来编码三种不同的指标,如上上图的中间部分。
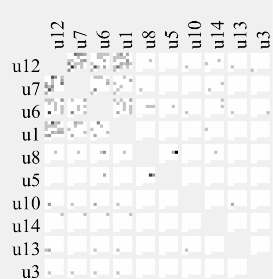
【STEIN K., WEGENER R., SCHLIEDER C.: Pixel-oriented visualization of change in social networks. In Proceedings of the 2010 International Conference on Advances in So- cial Networks Analysis and Mining (2010), ASONAM, IEEE, pp. 233–240.】:建议了一种pixel-based的方法(基于像素图),将时间轴折叠成为像素图。每一个像素(或者说一个单元)表达时间上的一个点,用来编码当前时间片段的边的权重。文章还提到了几种折叠时间轴的方法:row-by-row, column-by-column, diagonal, etc.
分层矩阵(Layered Matrixed)
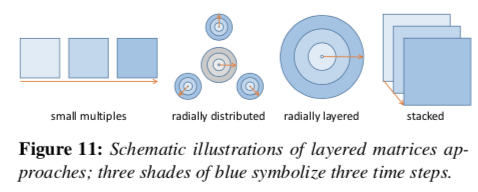
【BURCH M., DIEHL S.: TimeRadarTrees: Visualizing dynamic compound digraphs. Computer Graphics Forum 27, 3 (2008), 823–830.】&【BURCH M., HÖFERLIN M., WEISKOPF D.: Layered TimeRadarTrees. In Proceedings of the 15th International Conference on Information Visualisation (2011), IV, IEEE, pp. 18– 25.】:将边和边之间的关系以环形编码到圆上,如下图左边的大圆,红色部分表示有边链接到该节点,小圆则表示有边从该节点出去。圆形的径向则是时间轴,也即上图第二图所示(radially distributtd)
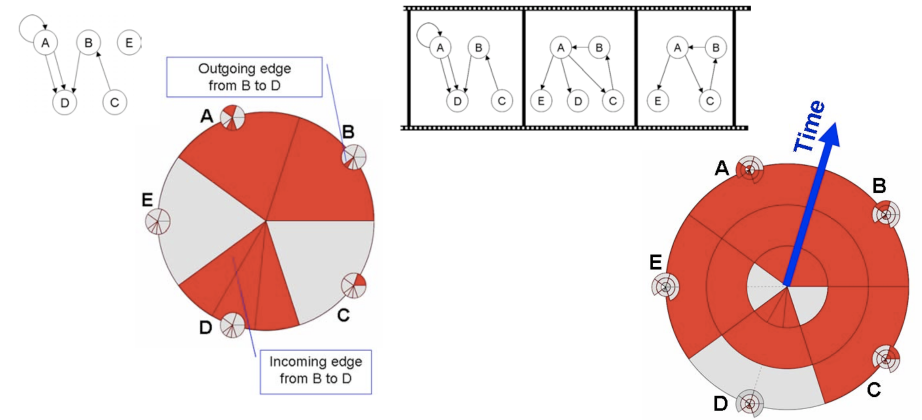
【VEHLOW C., BURCH M., SCHMAUDER H., WEISKOPF D.: Radial layered matrix visualization of dynamic graphs. In Proceedings of the 17th International Conference Information Visualisation (2013), IV, pp. 51–58.】:弯折矩阵变成圆环,每一个圆环都代表一个时刻,上上图 radially layered。
- 【BACH B., PIETRIGA E., FEKETE J.-D.: Visualizing dynamic networks with matrix cubes. In Procceedings of the SICCHI Conference on Human Factors in Computing Systems (2014), CHI.】将2D的图堆叠成3D的,上上图stacked。
Hybrid (Animation, Timeline)(对动画跟时间轴的混合)
- 【HADLAK S., SCHULZ H.-J., SCHUMANN H.: In situ exploration of large dynamic networks. IEEE Transactions on Visualization and Computer Graphics 17, 12 (2011), 2334–2343.】:将一些小的可视化集成到更大的可视化中,通过这样的方法可以将动画集成到时间轴中;
- 【SALLABERRY A., MUELDER C., MA K.-L.: Clustering, visualizing, and navigating for large dynamic graphs. In Graph Drawing (2012), GD, pp. 487–498.】:使用了一种基于时间轴的,但是也同样集成了通过节点链接图来表示的聚类演化动画。
- 【BECK F., BURCH M., VEHLOW C., DIEHL S., WEISKOPF D.: Rapid serial visual presentation in dynamic graph visualization. In Proceedings of the 2012 IEEE Sym- posium on Visual Languages and Human-Centric Comput- ing (2012), VL/HCC, IEEE, pp. 185–192.】:将很长序列的图利用Parallel Edge Splatting的技术,通过移动时间轴来演示动画。
- 【RUFIANGE S., MCGUFFIN M. J.: DiffAni: Visualizing dynamic graphs with a hybrid of difference maps and animation. IEEE Transactions on Visualization and Computer Graphics 19, 12 (2013), 2556–2565. 】:能够让用户将一部分时间轴集成为动画。
Research Challenges
在文章最后,作者讲了一些reseach challenges,对寻找科研问题比较有帮助,可以列举一下(不再细述evaluation部分)
- Visual Scalability:增加需要展示的数据,却仍要保留可读性,考虑三个维度,节点数量,边的密度以及时间。
- Hybrids:混合animation跟timeline,在静态图中已经很好的混合了节点链接跟矩阵。
- Extended Data Dimensions:静态图变到动态图是加入了时间这个维度,那么在其他场景下, 是否还能加入其他的维度。已经有的是加入节点的层次关系,形成复合图。值得被研究的内容还有:动态的多属性图,带有不确定信息的动态图,有地理位置的图。
- Interaction:navigation(导航),这个工作已经很多年没有人聚焦。在动态图中,用户不仅要在空间中进行导航,也需要在时间上进行导航。当然交互也可以用来集成多个模型(DiffAni)或者用来过滤数据。标注/编辑动态图都未进行研究。
- Application:文学作品中的人物分析,金融和生物医药传染网络,眼部追踪数据。